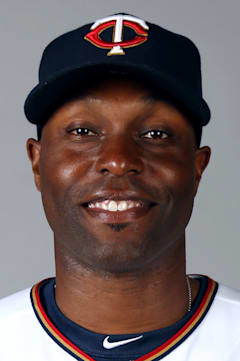
Torii Hunter
Hunter's nine Gold Gloves tell only half the story of his defensive wizardry. He redefined center field defense with spectacular diving catches and impossible wall-climbing grabs that robbed countless home runs, turning Fenway Park's Green Monster and the Metrodome's baggie into his personal highlight reel.
The offensive numbers — a steady .277 average with 353 homers — reflect a player who consistently delivered without ever quite reaching superstar status. His 105 career OPS+ places him squarely in the "very good" category, but Hunter's value transcended traditional metrics. He peaked at age 33 with the Angels in 2009, posting an .873 OPS that represented his best blend of power and contact.
Hunter embodied the prototype for the modern two-way center fielder, combining elite defense with reliable offensive production. His ability to impact games with his glove while contributing 20-plus homers annually made him invaluable during baseball's offensive explosion of the early 2000s.
Career · Batting
19 seasons| Year | Team | G | AB | HR | RBI | AVG | OPS | OPS+ |
|---|---|---|---|---|---|---|---|---|
| 1997 | MIN | 1 | 0 | 0 | 0 | — | — | — |
| 1998 | MIN | 6 | 17 | 0 | 2 | .235 | .610 | 81 |
| 1999 | MIN | 135 | 384 | 9 | 35 | .255 | .689 | 89 |
| 2000 | MIN | 99 | 336 | 5 | 44 | .280 | .726 | 93 |
| 2001 | MIN | 148 | 564 | 27 | 92 | .261 | .784 | 103 |
| 2002 | MIN | 148 | 561 | 29 | 94 | .289 | .859 | 115 |
| 2003 | MIN | 154 | 581 | 26 | 102 | .250 | .762 | 101 |
| 2004 | MIN | 138 | 520 | 23 | 81 | .271 | .805 | 106 |
| 2005 | MIN | 98 | 372 | 14 | 56 | .269 | .788 | 105 |
| 2006 | MIN | 147 | 557 | 31 | 98 | .278 | .826 | 107 |
| 2007 | MIN | 160 | 600 | 28 | 107 | .287 | .839 | 111 |
| 2008 | LAA | 146 | 551 | 21 | 78 | .278 | .810 | 108 |
| 2009 | LAA | 119 | 451 | 22 | 90 | .299 | .873 | 116 |
| 2010 | LAA | 152 | 573 | 23 | 90 | .281 | .819 | 112 |
| 2011 | LAA | 156 | 580 | 23 | 82 | .262 | .765 | 106 |
| 2012 | LAA | 140 | 534 | 16 | 92 | .313 | .817 | 113 |
| 2013 | DET | 144 | 606 | 17 | 84 | .304 | .800 | 112 |
| 2014 | DET | 142 | 549 | 17 | 83 | .286 | .765 | 109 |
| 2015 | MIN | 139 | 521 | 22 | 81 | .240 | .702 | 97 |
| Career | 2372 | 8857 | 353 | 1391 | .277 | — | — | |
Every ball this hitter has put in play — how hard it left the bat, and at what angle. The red field behind the dots shows how much damage that kind of contact does, league-wide: the darker the red, the better things go for the hitter.
The field — league-average xwOBA (what a batted ball is typically worth: 0.0 is a sure out, ~2.0 a sure home run) for every exit-velocity × launch-angle combination, measured from 1.3 million regular-season balls in play since 2015. The dark ridge — balls hit 105+ mph at 25–30° — is the barrel zone, where contact becomes near-automatic extra bases.
The dots — this hitter’s career regular-season balls in play, grouped to a fine grid; a bigger dot means more batted balls at that exact combination. Dots piled onto the red ridge are damage; dots low on the pale field are weak or mishit contact. Spring training and the postseason are excluded.
Matchups, projections, comps — grounded in Lahman, Retrosheet, and Statcast.