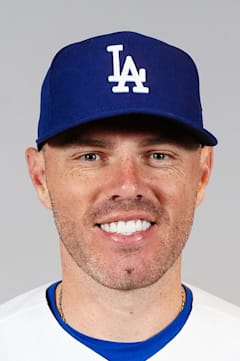
Freddie Freeman
Freeman's .300 career average through age 37 places him in rare company among modern first basemen, but his true artistry lies in clutch hitting. That silky swing delivered Atlanta's first World Series title since 1995, then seamlessly transitioned to Dodgers blue without missing a beat.
The 2020 MVP campaign showcased peak Freeman — a .341 average with video-game plate discipline in a shortened season. His 149 OPS+ that year represents the ceiling for a hitter who's maintained elite consistency across two decades. Nine All-Star selections tell the story of sustained excellence, but the Gold Glove hints at his underrated defensive value.
At 37, Freeman's .300 career mark becomes more impressive each season. Few first basemen maintain that standard this deep into their careers, making every at-bat a small piece of history.
| Date | AB | H | HR | RBI | BB | SO | AVG |
|---|---|---|---|---|---|---|---|
| Jul 19 | 2 | 0 | 0 | 0 | 2 | 1 | .285 |
| Jul 19 | 4 | 1 | 0 | 2 | 0 | 2 | .287 |
| Jul 17 | 4 | 0 | 0 | 0 | 0 | 3 | .287 |
| Jul 14 | 1 | 0 | 0 | 0 | 1 | 1 | .000 |
| Jul 12 | 4 | 0 | 0 | 0 | 0 | 0 | .290 |
| Jul 11 | 3 | 1 | 0 | 0 | 0 | 0 | .293 |
| Jul 10 | 3 | 0 | 0 | 0 | 0 | 1 | .293 |
| Jul 8 | 4 | 2 | 0 | 0 | 0 | 1 | .296 |
| Jul 7 | 5 | 2 | 0 | 0 | 0 | 1 | .293 |
| Jul 6 | 5 | 1 | 0 | 0 | 0 | 0 | .292 |
Career · Batting
17 seasons| Year | Team | G | AB | HR | RBI | AVG | OPS | OPS+ |
|---|---|---|---|---|---|---|---|---|
| 2010 | — | 20 | 24 | 1 | 1 | — | — | — |
| 2011 | — | 157 | 571 | 21 | 76 | — | — | — |
| 2012 | — | 147 | 540 | 23 | 94 | — | — | — |
| 2013 | — | 147 | 551 | 23 | 109 | — | — | — |
| 2014 | — | 162 | 607 | 18 | 78 | — | — | — |
| 2015 | — | 118 | 416 | 18 | 66 | — | — | — |
| 2016 | — | 158 | 589 | 34 | 91 | — | — | — |
| 2017 | — | 117 | 440 | 28 | 71 | — | — | — |
| 2018 | — | 162 | 618 | 23 | 98 | — | — | — |
| 2019 | — | 158 | 597 | 38 | 121 | — | — | — |
| 2020 | — | 60 | 214 | 13 | 53 | — | 1.102 | — |
| 2021 | — | 159 | 600 | 31 | 83 | — | — | — |
| 2022 | — | 159 | 612 | 21 | 100 | — | — | — |
| 2023 | — | 161 | 637 | 29 | 102 | — | — | — |
| 2024 | — | 147 | 542 | 22 | 89 | — | — | — |
| 2025 | — | 147 | 556 | 24 | 90 | — | — | — |
| 2026 | — | 96 | 363 | 15 | 51 | — | — | — |
| Career | 2275 | 8477 | 382 | 1373 | — | — | — | |
Every ball this hitter has put in play — how hard it left the bat, and at what angle. The red field behind the dots shows how much damage that kind of contact does, league-wide: the darker the red, the better things go for the hitter.
The field — league-average xwOBA (what a batted ball is typically worth: 0.0 is a sure out, ~2.0 a sure home run) for every exit-velocity × launch-angle combination, measured from 1.3 million regular-season balls in play since 2015. The dark ridge — balls hit 105+ mph at 25–30° — is the barrel zone, where contact becomes near-automatic extra bases.
The dots — this hitter’s career regular-season balls in play, grouped to a fine grid; a bigger dot means more batted balls at that exact combination. Dots piled onto the red ridge are damage; dots low on the pale field are weak or mishit contact. Spring training and the postseason are excluded.
Matchups, projections, comps — grounded in Lahman, Retrosheet, and Statcast.