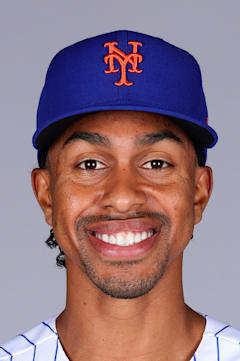
Francisco Lindor
Lindor has quietly assembled one of the more complete shortstop careers of the past decade, combining elite defense with consistent power production. His 279 career home runs rank among the highest totals ever for a primary shortstop, while his two Gold Gloves underscore defensive excellence that made him a franchise cornerstone in Cleveland before his high-profile move to New York.
The Puerto Rican star peaked in 2018 with 38 homers and an .871 OPS, showcasing the rare blend of power and contact that earned him four Silver Sluggers. While his .273 career average suggests solid rather than spectacular hitting, his 111 OPS+ over 11 seasons demonstrates above-average offensive production from a premium defensive position.
At 33, Lindor represents the prototype modern shortstop — athletic enough to handle the position's demands while providing legitimate middle-of-the-order thump. His five All-Star selections reflect sustained excellence in an era when shortstop depth has never been greater.
| Date | AB | H | HR | RBI | BB | SO | AVG |
|---|---|---|---|---|---|---|---|
| Jul 18 | 4 | 0 | 0 | 0 | 0 | 3 | .205 |
| Jul 16 | 4 | 0 | 0 | 0 | 0 | 0 | .210 |
| Jul 12 | 4 | 2 | 1 | 2 | 0 | 0 | .216 |
| Jul 11 | 3 | 0 | 0 | 0 | 1 | 0 | .208 |
| Jul 10 | 4 | 1 | 0 | 0 | 0 | 0 | .212 |
| Jul 8 | 4 | 1 | 0 | 0 | 0 | 1 | .211 |
| Jul 7 | 4 | 0 | 0 | 0 | 1 | 1 | .210 |
| Jul 6 | 5 | 0 | 0 | 0 | 0 | 1 | .216 |
| Jul 5 | 4 | 1 | 0 | 1 | 1 | 0 | .225 |
| Jul 4 | 4 | 2 | 0 | 0 | 0 | 1 | .224 |
Career · Batting
12 seasons| Year | Team | G | AB | HR | RBI | AVG | OPS | OPS+ |
|---|---|---|---|---|---|---|---|---|
| 2015 | — | 99 | 390 | 12 | 51 | — | — | — |
| 2016 | — | 158 | 604 | 15 | 78 | — | — | — |
| 2017 | — | 159 | 651 | 33 | 89 | — | — | — |
| 2018 | — | 158 | 661 | 38 | 92 | — | — | — |
| 2019 | — | 143 | 598 | 32 | 74 | — | — | — |
| 2020 | — | 60 | 236 | 8 | 27 | — | — | — |
| 2021 | — | 125 | 452 | 20 | 63 | — | — | — |
| 2022 | — | 161 | 630 | 26 | 107 | — | — | — |
| 2023 | — | 160 | 602 | 31 | 98 | — | — | — |
| 2024 | — | 152 | 618 | 33 | 91 | — | — | — |
| 2025 | — | 160 | 644 | 31 | 86 | — | — | — |
| 2026 | — | 43 | 164 | 6 | 15 | — | — | — |
| Career | 1578 | 6250 | 285 | 871 | — | — | — | |
Every ball this hitter has put in play — how hard it left the bat, and at what angle. The red field behind the dots shows how much damage that kind of contact does, league-wide: the darker the red, the better things go for the hitter.
The field — league-average xwOBA (what a batted ball is typically worth: 0.0 is a sure out, ~2.0 a sure home run) for every exit-velocity × launch-angle combination, measured from 1.3 million regular-season balls in play since 2015. The dark ridge — balls hit 105+ mph at 25–30° — is the barrel zone, where contact becomes near-automatic extra bases.
The dots — this hitter’s career regular-season balls in play, grouped to a fine grid; a bigger dot means more batted balls at that exact combination. Dots piled onto the red ridge are damage; dots low on the pale field are weak or mishit contact. Spring training and the postseason are excluded.
Matchups, projections, comps — grounded in Lahman, Retrosheet, and Statcast.