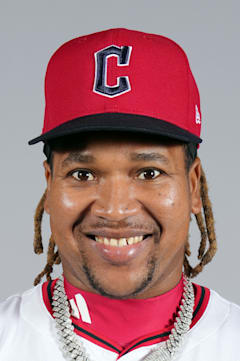
José Ramírez
The switch-hitting dynamo has quietly assembled one of the most consistent power profiles of the past decade, but 2025 marked a concerning inflection point. Ramirez's career 117 OPS+ represents elite production from the hot corner, yet his peak 134 OPS+ came during the abbreviated 2020 campaign — a season that feels increasingly like an outlier rather than a ceiling.
At 34, Ramirez enters his age-35 season having never quite recaptured that 2020 magic. His seven All-Star selections and six Silver Sluggers speak to sustained excellence, but the 285 career homers suggest he'll likely fall short of 300 — a milestone that seemed inevitable just a few years ago.
The Dominican Republic native remains Cleveland's franchise cornerstone, but time is becoming the enemy. His career .279 average has held steady, yet the power surge that defined his prime appears to be waning exactly when Father Time typically claims his due.
| Date | AB | H | HR | RBI | BB | SO | AVG |
|---|---|---|---|---|---|---|---|
| Jun 13 | 3 | 1 | 0 | 0 | 0 | 0 | .239 |
| Jun 12 | 4 | 0 | 0 | 0 | 0 | 1 | .238 |
| Jun 10 | 4 | 1 | 0 | 0 | 0 | 1 | .241 |
| Jun 9 | 5 | 2 | 0 | 0 | 0 | 1 | .241 |
| Jun 8 | 4 | 1 | 0 | 0 | 0 | 1 | .238 |
| Jun 7 | 4 | 0 | 0 | 0 | 0 | 2 | .238 |
| Jun 6 | 3 | 1 | 1 | 1 | 2 | 0 | .242 |
| Jun 5 | 4 | 0 | 0 | 0 | 0 | 2 | .241 |
| Jun 4 | 4 | 1 | 0 | 0 | 0 | 1 | .245 |
| Jun 3 | 4 | 3 | 1 | 1 | 0 | 0 | .245 |
Career · Batting
14 seasons| Year | Team | G | AB | HR | RBI | AVG | OPS | OPS+ |
|---|---|---|---|---|---|---|---|---|
| 2013 | — | 15 | 12 | 0 | 0 | — | — | — |
| 2014 | — | 68 | 237 | 2 | 17 | — | — | — |
| 2015 | — | 97 | 315 | 6 | 27 | — | — | — |
| 2016 | — | 152 | 565 | 11 | 76 | — | — | — |
| 2017 | — | 152 | 585 | 29 | 83 | — | — | — |
| 2018 | — | 157 | 578 | 39 | 105 | — | — | — |
| 2019 | — | 129 | 482 | 23 | 83 | — | — | — |
| 2020 | — | 58 | 219 | 17 | 46 | — | — | — |
| 2021 | — | 152 | 552 | 36 | 103 | — | — | — |
| 2022 | — | 157 | 601 | 29 | 126 | — | — | — |
| 2023 | — | 156 | 611 | 24 | 80 | — | — | — |
| 2024 | — | 158 | 620 | 39 | 118 | — | — | — |
| 2025 | — | 158 | 593 | 30 | 85 | — | — | — |
| 2026 | — | 72 | 268 | 10 | 33 | — | — | — |
| Career | 1681 | 6238 | 295 | 982 | — | — | — | |
Every ball this hitter has put in play — how hard it left the bat, and at what angle. The red field behind the dots shows how much damage that kind of contact does, league-wide: the darker the red, the better things go for the hitter.
The field — league-average xwOBA (what a batted ball is typically worth: 0.0 is a sure out, ~2.0 a sure home run) for every exit-velocity × launch-angle combination, measured from 1.3 million regular-season balls in play since 2015. The dark ridge — balls hit 105+ mph at 25–30° — is the barrel zone, where contact becomes near-automatic extra bases.
The dots — this hitter’s career regular-season balls in play, grouped to a fine grid; a bigger dot means more batted balls at that exact combination. Dots piled onto the red ridge are damage; dots low on the pale field are weak or mishit contact. Spring training and the postseason are excluded.
Matchups, projections, comps — grounded in Lahman, Retrosheet, and Statcast.