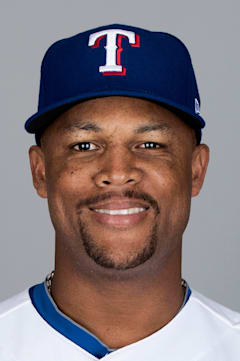
Adrian Beltre
Beltre hit exactly 3,000 career hits — finishing with 3,166 — but never chased the milestone like most players do. When he reached 2,999 in September 2017, he deliberately swung at the first pitch of his next at-bat, a testament to the playful personality that made him beloved across four franchises.
The Dominican third baseman's career splits into two distinct chapters: the tantalizing talent who peaked at 21 with that monster 2004 season in Los Angeles, then the steady veteran who became one of the game's most reliable forces. His 477 home runs and five Gold Gloves tell the story of rare two-way excellence at the hot corner.
What separated Beltre was his plate discipline evolution. Early in his career, he was a notorious first-pitch swinger who struggled with consistency. By his Texas years, he'd learned to work counts while maintaining that trademark gap power. The Hall of Fame voters recognized what scouts always knew — few players combined defensive wizardry with offensive production quite like Beltre.
Career · Batting
21 seasons| Year | Team | G | AB | HR | RBI | AVG | OPS | OPS+ |
|---|---|---|---|---|---|---|---|---|
| 1998 | LAD | 77 | 195 | 7 | 22 | .215 | .648 | 86 |
| 1999 | LAD | 152 | 538 | 15 | 67 | .275 | .780 | 100 |
| 2000 | LAD | 138 | 510 | 20 | 85 | .290 | .835 | 107 |
| 2001 | LAD | 126 | 475 | 13 | 60 | .265 | .720 | 95 |
| 2002 | LAD | 159 | 587 | 21 | 75 | .257 | .729 | 97 |
| 2003 | LAD | 158 | 559 | 23 | 80 | .240 | .714 | 95 |
| 2004 | LAD | 156 | 598 | 48 | 121 | .334 | 1.017 | 133 |
| 2005 | SEA | 156 | 603 | 19 | 87 | .255 | .716 | 96 |
| 2006 | SEA | 156 | 620 | 25 | 89 | .268 | .792 | 103 |
| 2007 | SEA | 149 | 595 | 26 | 99 | .276 | .802 | 106 |
| 2008 | SEA | 143 | 556 | 25 | 77 | .266 | .784 | 105 |
| 2009 | SEA | 111 | 449 | 8 | 44 | .265 | .683 | 91 |
| 2010 | BOS | 154 | 589 | 28 | 102 | .321 | .919 | 126 |
| 2011 | TEX | 124 | 487 | 32 | 105 | .296 | .892 | 124 |
| 2012 | TEX | 156 | 604 | 36 | 102 | .321 | .921 | 127 |
| 2013 | TEX | 161 | 631 | 30 | 92 | .315 | .880 | 123 |
| 2014 | TEX | 148 | 549 | 19 | 77 | .324 | .879 | 126 |
| 2015 | TEX | 143 | 567 | 18 | 83 | .287 | .788 | 109 |
| 2016 | TEX | 153 | 583 | 32 | 104 | .300 | .879 | 119 |
| 2017 | TEX | 94 | 340 | 17 | 71 | .312 | .915 | 122 |
| 2018 | TEX | 119 | 433 | 15 | 65 | .273 | .763 | 105 |
| Career | 2933 | 11068 | 477 | 1707 | .286 | — | — | |
Every ball this hitter has put in play — how hard it left the bat, and at what angle. The red field behind the dots shows how much damage that kind of contact does, league-wide: the darker the red, the better things go for the hitter.
The field — league-average xwOBA (what a batted ball is typically worth: 0.0 is a sure out, ~2.0 a sure home run) for every exit-velocity × launch-angle combination, measured from 1.3 million regular-season balls in play since 2015. The dark ridge — balls hit 105+ mph at 25–30° — is the barrel zone, where contact becomes near-automatic extra bases.
The dots — this hitter’s career regular-season balls in play, grouped to a fine grid; a bigger dot means more batted balls at that exact combination. Dots piled onto the red ridge are damage; dots low on the pale field are weak or mishit contact. Spring training and the postseason are excluded.
Matchups, projections, comps — grounded in Lahman, Retrosheet, and Statcast.