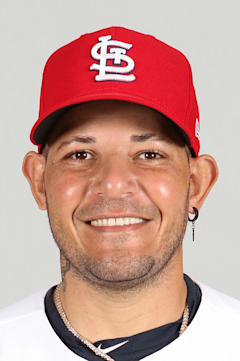
Yadier Molina
The greatest defensive catcher of his generation retired with below-average offensive production by design — and that's exactly what made him invaluable. Molina's .277 career average and 97 OPS+ tell only half the story of a player who redefined what teams expected from the position.
Those nine Gold Gloves weren't ceremonial hardware. Molina controlled running games, framed pitches before it was cool, and turned Cardinals pitchers into Cy Young contenders through sheer game management. His 2012 breakout (.315/.373/.501) proved he could hit when healthy, but his real value lived in the 60 feet, six inches between the mound and home plate.
The Cardinals won two World Series with Molina behind the plate, and his influence extended far beyond box scores. He caught three no-hitters and mentored a generation of St. Louis pitchers who credited their success to his game-calling brilliance.
Career · Batting
19 seasons| Year | Team | G | AB | HR | RBI | AVG | OPS | OPS+ |
|---|---|---|---|---|---|---|---|---|
| 2004 | STL | 51 | 135 | 2 | 15 | .267 | .684 | 90 |
| 2005 | STL | 114 | 385 | 8 | 49 | .252 | .654 | 87 |
| 2006 | STL | 129 | 417 | 6 | 49 | .216 | .595 | 77 |
| 2007 | STL | 111 | 353 | 6 | 40 | .275 | .708 | 93 |
| 2008 | STL | 124 | 444 | 7 | 56 | .304 | .740 | 99 |
| 2009 | STL | 140 | 481 | 6 | 54 | .293 | .749 | 100 |
| 2010 | STL | 136 | 465 | 6 | 62 | .262 | .671 | 92 |
| 2011 | STL | 139 | 475 | 14 | 65 | .305 | .814 | 113 |
| 2012 | STL | 138 | 505 | 22 | 76 | .315 | .874 | 121 |
| 2013 | STL | 136 | 505 | 12 | 80 | .319 | .836 | 117 |
| 2014 | STL | 110 | 404 | 7 | 38 | .282 | .719 | 103 |
| 2015 | STL | 136 | 488 | 4 | 61 | .270 | .660 | 91 |
| 2016 | STL | 147 | 534 | 8 | 58 | .307 | .787 | 106 |
| 2017 | STL | 136 | 501 | 18 | 82 | .273 | .751 | 100 |
| 2018 | STL | 123 | 459 | 20 | 74 | .261 | .750 | 103 |
| 2019 | STL | 113 | 419 | 10 | 57 | .270 | .711 | 94 |
| 2020 | STL | 42 | 145 | 4 | 16 | .262 | .662 | 90 |
| 2021 | STL | 121 | 440 | 11 | 66 | .252 | .667 | 92 |
| 2022 | STL | 80 | 262 | 5 | 24 | .214 | .535 | 76 |
| Career | 2226 | 7817 | 176 | 1022 | .277 | — | — | |
Every ball this hitter has put in play — how hard it left the bat, and at what angle. The red field behind the dots shows how much damage that kind of contact does, league-wide: the darker the red, the better things go for the hitter.
The field — league-average xwOBA (what a batted ball is typically worth: 0.0 is a sure out, ~2.0 a sure home run) for every exit-velocity × launch-angle combination, measured from 1.3 million regular-season balls in play since 2015. The dark ridge — balls hit 105+ mph at 25–30° — is the barrel zone, where contact becomes near-automatic extra bases.
The dots — this hitter’s career regular-season balls in play, grouped to a fine grid; a bigger dot means more batted balls at that exact combination. Dots piled onto the red ridge are damage; dots low on the pale field are weak or mishit contact. Spring training and the postseason are excluded.
Matchups, projections, comps — grounded in Lahman, Retrosheet, and Statcast.