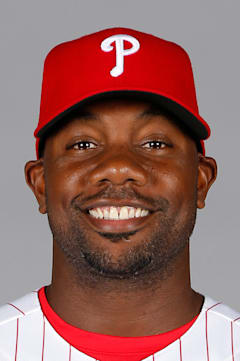
Ryan Howard
Howard's 58 home runs in 2006 made him just the second player ever to reach that mark in his first full season, capping one of the most explosive rookie campaigns in baseball history. The lefty slugger became the fastest player to 100 career homers, reaching the milestone in just 325 games.
The peak was spectacular but brief. Howard's swing-and-miss approach worked brilliantly when he was turning on fastballs, but his 26.4 percent career strikeout rate foreshadowed the steep decline that followed his MVP season. After 2011, injuries and shifting defensive strategies exposed his limitations.
That 2006 season remains a monument to pure power. Howard's 149 RBIs led the majors by 12, and his 1.084 OPS carried Philadelphia's offense. He proved that in the right circumstances, a one-dimensional slugger could still dominate baseball — even if only for a few years.
Career · Batting
13 seasons| Year | Team | G | AB | HR | RBI | AVG | OPS | OPS+ |
|---|---|---|---|---|---|---|---|---|
| 2004 | PHI | 19 | 39 | 2 | 5 | .282 | .897 | 118 |
| 2005 | PHI | 88 | 312 | 22 | 63 | .288 | .924 | 123 |
| 2006 | PHI | 159 | 581 | 58 | 149 | .313 | 1.084 | 141 |
| 2007 | PHI | 144 | 529 | 47 | 136 | .268 | .976 | 129 |
| 2008 | PHI | 162 | 610 | 48 | 146 | .251 | .881 | 118 |
| 2009 | PHI | 160 | 616 | 45 | 141 | .279 | .931 | 124 |
| 2010 | PHI | 143 | 550 | 31 | 108 | .276 | .859 | 118 |
| 2011 | PHI | 152 | 557 | 33 | 116 | .253 | .835 | 116 |
| 2012 | PHI | 71 | 260 | 14 | 56 | .219 | .718 | 99 |
| 2013 | PHI | 80 | 286 | 11 | 43 | .266 | .784 | 110 |
| 2014 | PHI | 153 | 569 | 23 | 95 | .223 | .690 | 99 |
| 2015 | PHI | 129 | 467 | 23 | 77 | .229 | .720 | 100 |
| 2016 | PHI | 112 | 331 | 25 | 59 | .196 | .710 | 96 |
| Career | 1572 | 5707 | 382 | 1194 | .258 | — | — | |
Every ball this hitter has put in play — how hard it left the bat, and at what angle. The red field behind the dots shows how much damage that kind of contact does, league-wide: the darker the red, the better things go for the hitter.
The field — league-average xwOBA (what a batted ball is typically worth: 0.0 is a sure out, ~2.0 a sure home run) for every exit-velocity × launch-angle combination, measured from 1.3 million regular-season balls in play since 2015. The dark ridge — balls hit 105+ mph at 25–30° — is the barrel zone, where contact becomes near-automatic extra bases.
The dots — this hitter’s career regular-season balls in play, grouped to a fine grid; a bigger dot means more batted balls at that exact combination. Dots piled onto the red ridge are damage; dots low on the pale field are weak or mishit contact. Spring training and the postseason are excluded.
Matchups, projections, comps — grounded in Lahman, Retrosheet, and Statcast.