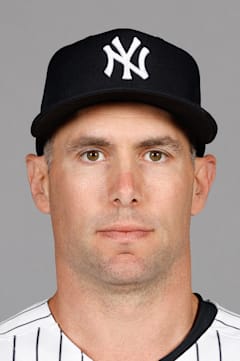
Paul Goldschmidt
Goldschmidt's remarkable consistency finally cracked in 2025, posting his lowest OPS+ since his rookie year while battling Father Time at age 37. The seven-time All-Star saw his power numbers dip significantly from his peak years, though he maintained respectable production through most of his Cardinals tenure.
What separates Goldschmidt from other sluggers is that defensive excellence — four Gold Gloves prove he was never just a bat-first first baseman. His 2015 MVP campaign in Arizona remains his masterpiece: a .321 average with 33 homers and that sparkling 1.005 OPS represents the perfect blend of contact and power that defined his prime.
At 39, Goldschmidt enters what's likely his final season having carved out a Hall of Fame-caliber resume. That career 121 OPS+ across 15 seasons tells the story of sustained excellence, even if the recent decline suggests his days as an impact player are numbered.
| Date | AB | H | HR | RBI | BB | SO | AVG |
|---|---|---|---|---|---|---|---|
| Jul 17 | 3 | 0 | 0 | 0 | 1 | 2 | .255 |
| Jul 11 | 4 | 1 | 1 | 1 | 0 | 1 | .259 |
| Jul 10 | 5 | 2 | 0 | 0 | 0 | 1 | .260 |
| Jul 8 | 4 | 0 | 0 | 0 | 0 | 3 | .257 |
| Jul 7 | 4 | 0 | 0 | 0 | 0 | 4 | .261 |
| Jul 6 | 4 | 0 | 0 | 0 | 0 | 3 | .266 |
| Jul 3 | 4 | 0 | 0 | 0 | 0 | 1 | .273 |
| Jun 30 | 4 | 0 | 0 | 0 | 0 | 1 | .278 |
| Jun 29 | 4 | 0 | 0 | 0 | 0 | 2 | .284 |
| Jun 27 | 3 | 0 | 0 | 0 | 1 | 0 | .291 |
Career · Batting
16 seasons| Year | Team | G | AB | HR | RBI | AVG | OPS | OPS+ |
|---|---|---|---|---|---|---|---|---|
| 2011 | — | 48 | 156 | 8 | 26 | — | — | — |
| 2012 | — | 145 | 514 | 20 | 82 | — | — | — |
| 2013 | — | 160 | 602 | 36 | 125 | — | — | — |
| 2014 | — | 109 | 406 | 19 | 69 | — | — | — |
| 2015 | — | 159 | 567 | 33 | 110 | — | 1.005 | — |
| 2016 | — | 158 | 579 | 24 | 95 | — | — | — |
| 2017 | — | 155 | 558 | 36 | 120 | — | — | — |
| 2018 | — | 158 | 593 | 33 | 83 | — | — | — |
| 2019 | — | 161 | 597 | 34 | 97 | — | — | — |
| 2020 | — | 58 | 191 | 6 | 21 | — | — | — |
| 2021 | — | 158 | 603 | 31 | 99 | — | — | — |
| 2022 | — | 151 | 561 | 35 | 115 | — | — | — |
| 2023 | — | 154 | 593 | 25 | 80 | — | — | — |
| 2024 | — | 154 | 599 | 22 | 65 | — | — | — |
| 2025 | — | 146 | 489 | 10 | 45 | — | — | — |
| 2026 | — | 70 | 247 | 15 | 42 | — | — | — |
| Career | 2144 | 7855 | 387 | 1274 | — | — | — | |
Every ball this hitter has put in play — how hard it left the bat, and at what angle. The red field behind the dots shows how much damage that kind of contact does, league-wide: the darker the red, the better things go for the hitter.
The field — league-average xwOBA (what a batted ball is typically worth: 0.0 is a sure out, ~2.0 a sure home run) for every exit-velocity × launch-angle combination, measured from 1.3 million regular-season balls in play since 2015. The dark ridge — balls hit 105+ mph at 25–30° — is the barrel zone, where contact becomes near-automatic extra bases.
The dots — this hitter’s career regular-season balls in play, grouped to a fine grid; a bigger dot means more batted balls at that exact combination. Dots piled onto the red ridge are damage; dots low on the pale field are weak or mishit contact. Spring training and the postseason are excluded.
Matchups, projections, comps — grounded in Lahman, Retrosheet, and Statcast.