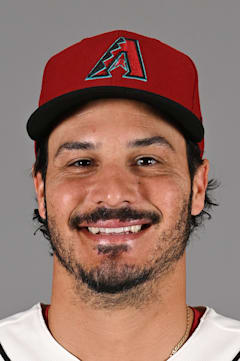
Nolan Arenado
Arenado's glove remains his calling card even as his bat shows signs of age. The 10-time Gold Glover posted a career-low .266 average in 2025, his third straight season below .280 after never dipping under that mark in his first decade. His power has stabilized around 25-30 homers annually since leaving Coors Field, a far cry from his peak Colorado years.
The defensive wizardry endures at 35. Arenado's arm strength and instincts at third base haven't diminished, making him valuable even if his offensive peak is behind him. His 2018 campaign in Colorado represents the pinnacle — 38 homers with an OPS+ of 129 that he's never matched since.
The question entering his age-35 season isn't whether he can still field — it's how much longer his bat can justify everyday play. Teams will live with declining offense for elite defense, but that equation changes quickly in baseball.
| Date | AB | H | HR | RBI | BB | SO | AVG |
|---|---|---|---|---|---|---|---|
| Jul 18 | 4 | 2 | 0 | 2 | 0 | 0 | .244 |
| Jul 17 | 3 | 0 | 0 | 0 | 1 | 2 | .240 |
| Jul 12 | 4 | 1 | 0 | 1 | 0 | 0 | .243 |
| Jul 11 | 3 | 1 | 1 | 1 | 1 | 0 | .243 |
| Jul 10 | 2 | 0 | 0 | 0 | 3 | 2 | .242 |
| Jul 9 | 4 | 1 | 1 | 1 | 0 | 3 | .243 |
| Jul 8 | 4 | 3 | 0 | 0 | 0 | 0 | .243 |
| Jul 7 | 4 | 0 | 0 | 0 | 0 | 2 | .236 |
| Jul 6 | 4 | 1 | 1 | 1 | 0 | 1 | .240 |
| Jul 4 | 3 | 0 | 0 | 0 | 0 | 1 | .239 |
Career · Batting
14 seasons| Year | Team | G | AB | HR | RBI | AVG | OPS | OPS+ |
|---|---|---|---|---|---|---|---|---|
| 2013 | — | 133 | 486 | 10 | 52 | — | — | — |
| 2014 | — | 111 | 432 | 18 | 61 | — | — | — |
| 2015 | — | 157 | 616 | 42 | 130 | — | — | — |
| 2016 | — | 160 | 618 | 41 | 133 | — | — | — |
| 2017 | — | 159 | 606 | 37 | 130 | — | — | — |
| 2018 | — | 156 | 590 | 38 | 110 | — | — | — |
| 2019 | — | 155 | 588 | 41 | 118 | — | — | — |
| 2020 | — | 48 | 182 | 8 | 26 | — | — | — |
| 2021 | — | 157 | 593 | 34 | 105 | — | — | — |
| 2022 | — | 148 | 557 | 30 | 103 | — | — | — |
| 2023 | — | 144 | 560 | 26 | 93 | — | — | — |
| 2024 | — | 152 | 578 | 16 | 71 | — | — | — |
| 2025 | — | 107 | 401 | 12 | 52 | — | — | — |
| 2026 | — | 93 | 320 | 13 | 44 | — | — | — |
| Career | 1880 | 7127 | 366 | 1228 | — | — | — | |
Every ball this hitter has put in play — how hard it left the bat, and at what angle. The red field behind the dots shows how much damage that kind of contact does, league-wide: the darker the red, the better things go for the hitter.
The field — league-average xwOBA (what a batted ball is typically worth: 0.0 is a sure out, ~2.0 a sure home run) for every exit-velocity × launch-angle combination, measured from 1.3 million regular-season balls in play since 2015. The dark ridge — balls hit 105+ mph at 25–30° — is the barrel zone, where contact becomes near-automatic extra bases.
The dots — this hitter’s career regular-season balls in play, grouped to a fine grid; a bigger dot means more batted balls at that exact combination. Dots piled onto the red ridge are damage; dots low on the pale field are weak or mishit contact. Spring training and the postseason are excluded.
Matchups, projections, comps — grounded in Lahman, Retrosheet, and Statcast.