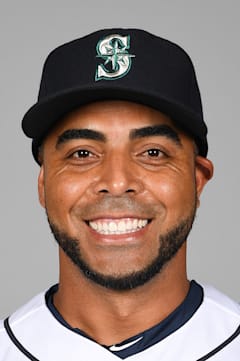
Nelson Cruz
The Dominican veteran squeezed 19 seasons out of pure power, but his peak came in an unexpected package. Cruz's best year wasn't built on mammoth home run totals — his 2008 campaign featured just seven long balls across 115 games, yet produced a gaudy .330 average and 1.030 OPS that represented the pinnacle of his offensive prowess.
That season reveals the complete hitter Cruz could be when healthy and locked in, combining his natural power stroke with exceptional plate discipline and contact skills. His 464 career home runs tell the story of remarkable longevity for a player who didn't become a full-time regular until age 28, consistently posting an OPS+ of 115 across nearly two decades.
Cruz exemplified the modern designated hitter evolution, proving that pure offense could sustain a lengthy career even without defensive value. His seven All-Star selections span 13 seasons, a testament to his ability to reinvent his approach while maintaining elite power production well into his forties.
Career · Batting
19 seasons| Year | Team | G | AB | HR | RBI | AVG | OPS | OPS+ |
|---|---|---|---|---|---|---|---|---|
| 2005 | MIL | 8 | 5 | 0 | 0 | .200 | .829 | 111 |
| 2006 | TEX | 41 | 130 | 6 | 22 | .223 | .645 | 84 |
| 2007 | TEX | 96 | 307 | 9 | 34 | .235 | .671 | 88 |
| 2008 | TEX | 31 | 115 | 7 | 26 | .330 | 1.030 | 137 |
| 2009 | TEX | 128 | 462 | 33 | 76 | .260 | .856 | 114 |
| 2010 | TEX | 108 | 399 | 22 | 78 | .318 | .950 | 130 |
| 2011 | TEX | 124 | 475 | 29 | 87 | .263 | .821 | 114 |
| 2012 | TEX | 159 | 585 | 24 | 90 | .260 | .779 | 108 |
| 2013 | TEX | 109 | 413 | 27 | 76 | .266 | .833 | 117 |
| 2014 | BAL | 159 | 613 | 40 | 108 | .271 | .859 | 123 |
| 2015 | SEA | 152 | 590 | 44 | 93 | .302 | .936 | 130 |
| 2016 | SEA | 155 | 589 | 43 | 105 | .287 | .915 | 124 |
| 2017 | SEA | 155 | 556 | 39 | 119 | .288 | .924 | 123 |
| 2018 | SEA | 144 | 519 | 37 | 97 | .256 | .850 | 117 |
| 2019 | MIN | 120 | 454 | 41 | 108 | .311 | 1.031 | 136 |
| 2020 | MIN | 53 | 185 | 16 | 33 | .303 | .992 | 134 |
| 2021 | MIN | 140 | 513 | 32 | 86 | .265 | .832 | 114 |
| 2022 | WSH | 124 | 448 | 10 | 64 | .234 | .651 | 92 |
| 2023 | SD | 49 | 143 | 5 | 23 | .245 | .681 | 93 |
| Career | 2055 | 7501 | 464 | 1325 | .274 | — | — | |
Every ball this hitter has put in play — how hard it left the bat, and at what angle. The red field behind the dots shows how much damage that kind of contact does, league-wide: the darker the red, the better things go for the hitter.
The field — league-average xwOBA (what a batted ball is typically worth: 0.0 is a sure out, ~2.0 a sure home run) for every exit-velocity × launch-angle combination, measured from 1.3 million regular-season balls in play since 2015. The dark ridge — balls hit 105+ mph at 25–30° — is the barrel zone, where contact becomes near-automatic extra bases.
The dots — this hitter’s career regular-season balls in play, grouped to a fine grid; a bigger dot means more batted balls at that exact combination. Dots piled onto the red ridge are damage; dots low on the pale field are weak or mishit contact. Spring training and the postseason are excluded.
Matchups, projections, comps — grounded in Lahman, Retrosheet, and Statcast.