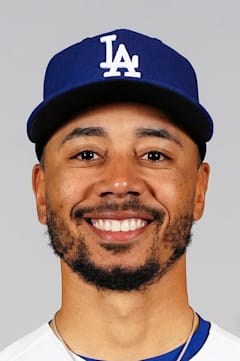
Mookie Betts
Betts enters what should be his decline phase hitting .290 with an OPS+ of 121 over 12 seasons — numbers that reveal a player who's been consistently excellent without ever quite reaching the inner circle of superstardom. His 2018 MVP campaign remains the outlier, a .346 average and 1.078 OPS that represented a 27-point leap from his career norm.
The six Gold Gloves tell the real story. While his bat has been very good, his glove has been elite throughout, making him valuable even as his offensive peak fades. At 34, the question isn't whether he'll decline — it's how gracefully a player who built his reputation on athleticism ages.
That 2018 season looks increasingly like lightning in a bottle. Everything since has been solid but unremarkable offensively, suggesting we saw the best of Betts when he helped Boston to a World Series title.
| Date | AB | H | HR | RBI | BB | SO | AVG |
|---|---|---|---|---|---|---|---|
| Jul 17 | 3 | 0 | 0 | 0 | 1 | 0 | .232 |
| Jul 12 | 4 | 0 | 0 | 0 | 0 | 0 | .235 |
| Jul 11 | 3 | 1 | 0 | 1 | 0 | 0 | .239 |
| Jul 10 | 3 | 1 | 0 | 0 | 0 | 0 | .238 |
| Jul 8 | 3 | 1 | 0 | 1 | 1 | 1 | .237 |
| Jul 6 | 5 | 0 | 0 | 0 | 0 | 0 | .236 |
| Jul 5 | 3 | 0 | 0 | 0 | 1 | 0 | .241 |
| Jul 4 | 4 | 1 | 0 | 0 | 0 | 0 | .244 |
| Jul 3 | 3 | 0 | 0 | 0 | 1 | 0 | .244 |
| Jul 2 | 5 | 2 | 0 | 1 | 0 | 0 | .248 |
Career · Batting
13 seasons| Year | Team | G | AB | HR | RBI | AVG | OPS | OPS+ |
|---|---|---|---|---|---|---|---|---|
| 2014 | — | 52 | 189 | 5 | 18 | — | — | — |
| 2015 | — | 145 | 597 | 18 | 77 | — | — | — |
| 2016 | — | 158 | 672 | 31 | 113 | — | — | — |
| 2017 | — | 153 | 628 | 24 | 102 | — | — | — |
| 2018 | — | 136 | 520 | 32 | 80 | — | 1.078 | — |
| 2019 | — | 150 | 597 | 29 | 80 | — | — | — |
| 2020 | — | 55 | 219 | 16 | 39 | — | — | — |
| 2021 | — | 122 | 466 | 23 | 58 | — | — | — |
| 2022 | — | 142 | 572 | 35 | 82 | — | — | — |
| 2023 | — | 152 | 584 | 39 | 107 | — | — | — |
| 2024 | — | 116 | 450 | 19 | 75 | — | — | — |
| 2025 | — | 150 | 589 | 20 | 82 | — | — | — |
| 2026 | — | 63 | 248 | 11 | 31 | — | — | — |
| Career | 1594 | 6331 | 302 | 944 | — | — | — | |
Every ball this hitter has put in play — how hard it left the bat, and at what angle. The red field behind the dots shows how much damage that kind of contact does, league-wide: the darker the red, the better things go for the hitter.
The field — league-average xwOBA (what a batted ball is typically worth: 0.0 is a sure out, ~2.0 a sure home run) for every exit-velocity × launch-angle combination, measured from 1.3 million regular-season balls in play since 2015. The dark ridge — balls hit 105+ mph at 25–30° — is the barrel zone, where contact becomes near-automatic extra bases.
The dots — this hitter’s career regular-season balls in play, grouped to a fine grid; a bigger dot means more batted balls at that exact combination. Dots piled onto the red ridge are damage; dots low on the pale field are weak or mishit contact. Spring training and the postseason are excluded.
Matchups, projections, comps — grounded in Lahman, Retrosheet, and Statcast.