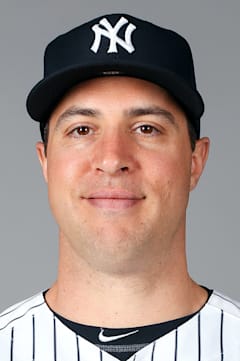
Mark Teixeira
Teixeira's defensive wizardry gets overshadowed by the home run total, but those five Gold Gloves tell the real story. He was arguably the best fielding first baseman of his generation, combining smooth hands with surprising range that helped anchor multiple contenders' infields.
The switch-hitting slugger peaked right before joining the Yankees, posting a .962 OPS in his lone Atlanta season. That 2008 campaign showcased his complete skill set — 33 homers, a .308 average, and elite defense that made him the prize of that winter's free agent market.
His 409 career homers represent steady, reliable power rather than breathtaking peaks. Teixeira was the prototypical modern first baseman: patient at the plate, dangerous from both sides, and defensively excellent. The Yankees got exactly what they paid for during his injury-shortened but productive Bronx tenure.
Career · Batting
14 seasons| Year | Team | G | AB | HR | RBI | AVG | OPS | OPS+ |
|---|---|---|---|---|---|---|---|---|
| 2003 | TEX | 146 | 529 | 26 | 84 | .259 | .811 | 107 |
| 2004 | TEX | 145 | 545 | 38 | 112 | .281 | .929 | 122 |
| 2005 | TEX | 162 | 644 | 43 | 144 | .301 | .954 | 127 |
| 2006 | TEX | 162 | 628 | 33 | 110 | .282 | .886 | 115 |
| 2007 | TEX | 132 | 494 | 30 | 105 | .306 | .963 | 127 |
| 2008 | ATL | 157 | 574 | 33 | 121 | .308 | .962 | 128 |
| 2009 | NYY | 156 | 609 | 39 | 122 | .292 | .948 | 126 |
| 2010 | NYY | 158 | 601 | 33 | 108 | .256 | .846 | 116 |
| 2011 | NYY | 156 | 589 | 39 | 111 | .248 | .835 | 116 |
| 2012 | NYY | 123 | 451 | 24 | 84 | .251 | .807 | 111 |
| 2013 | NYY | 15 | 53 | 3 | 12 | .151 | .609 | 85 |
| 2014 | NYY | 123 | 440 | 22 | 62 | .216 | .711 | 102 |
| 2015 | NYY | 111 | 392 | 31 | 79 | .255 | .906 | 126 |
| 2016 | NYY | 116 | 387 | 15 | 44 | .204 | .654 | 88 |
| Career | 1862 | 6936 | 409 | 1298 | .268 | — | — | |
Every ball this hitter has put in play — how hard it left the bat, and at what angle. The red field behind the dots shows how much damage that kind of contact does, league-wide: the darker the red, the better things go for the hitter.
The field — league-average xwOBA (what a batted ball is typically worth: 0.0 is a sure out, ~2.0 a sure home run) for every exit-velocity × launch-angle combination, measured from 1.3 million regular-season balls in play since 2015. The dark ridge — balls hit 105+ mph at 25–30° — is the barrel zone, where contact becomes near-automatic extra bases.
The dots — this hitter’s career regular-season balls in play, grouped to a fine grid; a bigger dot means more batted balls at that exact combination. Dots piled onto the red ridge are damage; dots low on the pale field are weak or mishit contact. Spring training and the postseason are excluded.
Matchups, projections, comps — grounded in Lahman, Retrosheet, and Statcast.