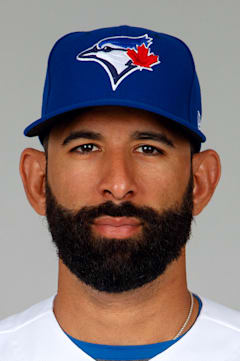
Jose Bautista
The bat flip heard 'round the world belongs to a player who reinvented himself in the most dramatic fashion imaginable. Before 2010, Bautista was a journeyman utility player with 37 career home runs across six seasons. Then something clicked in Toronto — he exploded for 54 homers in 2010 and followed with 43 more in 2011, posting a ridiculous 1.056 OPS that season.
That two-year burst from 2010-2011 produced 97 home runs and established him as one of the game's most feared sluggers. His 344 career homers and three Silver Slugger awards tell the story of a late bloomer who maximized every ounce of his talent once he found his swing.
The numbers reveal a player who understood his role perfectly — get on base, hit for power, and drive in runs. His 107 career OPS+ proves he was a consistently above-average hitter throughout his peak years, turning himself from organizational filler into a franchise cornerstone through sheer determination.
Career · Batting
15 seasons| Year | Team | G | AB | HR | RBI | AVG | OPS | OPS+ |
|---|---|---|---|---|---|---|---|---|
| 2004 | PIT | 64 | 88 | 0 | 2 | .205 | .502 | 66 |
| 2005 | PIT | 11 | 28 | 0 | 1 | .143 | .404 | 54 |
| 2006 | PIT | 117 | 400 | 16 | 51 | .235 | .755 | 98 |
| 2007 | PIT | 142 | 532 | 15 | 63 | .254 | .753 | 99 |
| 2008 | PIT | 128 | 370 | 15 | 54 | .238 | .718 | 96 |
| 2009 | TOR | 113 | 336 | 13 | 40 | .235 | .757 | 101 |
| 2010 | TOR | 161 | 569 | 54 | 124 | .260 | .995 | 137 |
| 2011 | TOR | 149 | 513 | 43 | 103 | .302 | 1.056 | 147 |
| 2012 | TOR | 92 | 332 | 27 | 65 | .241 | .886 | 122 |
| 2013 | TOR | 118 | 452 | 28 | 73 | .259 | .856 | 120 |
| 2014 | TOR | 155 | 553 | 35 | 103 | .286 | .928 | 133 |
| 2015 | TOR | 153 | 543 | 40 | 114 | .250 | .913 | 127 |
| 2016 | TOR | 116 | 423 | 22 | 69 | .234 | .817 | 111 |
| 2017 | TOR | 157 | 587 | 23 | 65 | .203 | .674 | 90 |
| 2018 | NYM | 122 | 325 | 13 | 48 | .203 | .727 | 100 |
| Career | 1798 | 6051 | 344 | 975 | .247 | — | — | |
Every ball this hitter has put in play — how hard it left the bat, and at what angle. The red field behind the dots shows how much damage that kind of contact does, league-wide: the darker the red, the better things go for the hitter.
The field — league-average xwOBA (what a batted ball is typically worth: 0.0 is a sure out, ~2.0 a sure home run) for every exit-velocity × launch-angle combination, measured from 1.3 million regular-season balls in play since 2015. The dark ridge — balls hit 105+ mph at 25–30° — is the barrel zone, where contact becomes near-automatic extra bases.
The dots — this hitter’s career regular-season balls in play, grouped to a fine grid; a bigger dot means more batted balls at that exact combination. Dots piled onto the red ridge are damage; dots low on the pale field are weak or mishit contact. Spring training and the postseason are excluded.
Matchups, projections, comps — grounded in Lahman, Retrosheet, and Statcast.