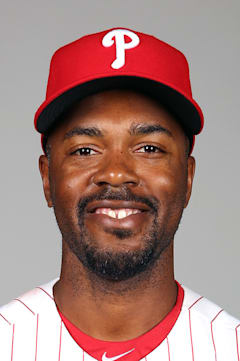
Jimmy Rollins
Rollins delivered MVP magic in the most unlikely way — a middle infielder who combined 30 homers with Gold Glove defense and clubhouse leadership that dragged Philadelphia from irrelevance to a championship. His 2007 season represents the blueprint for modern shortstop excellence, posting an .875 OPS while anchoring the left side of the infield.
The career numbers tell the story of remarkable durability rather than peak dominance. Over 2,275 games, Rollins maintained league-average offensive production (98 OPS+) while providing elite defense at baseball's most demanding position. Four Gold Gloves validate what Philadelphia fans witnessed nightly — a shortstop who could turn impossible plays routine.
That 2007 MVP campaign stands as his defining moment, when he became the rare middle infielder to crack 30 homers while maintaining defensive excellence. The timing proved perfect, launching the Phillies' run to their 2008 World Series title.
Career · Batting
17 seasons| Year | Team | G | AB | HR | RBI | AVG | OPS | OPS+ |
|---|---|---|---|---|---|---|---|---|
| 2000 | PHI | 14 | 53 | 0 | 5 | .321 | .723 | 92 |
| 2001 | PHI | 158 | 656 | 14 | 54 | .274 | .743 | 98 |
| 2002 | PHI | 154 | 637 | 11 | 60 | .245 | .686 | 92 |
| 2003 | PHI | 156 | 628 | 8 | 62 | .263 | .707 | 94 |
| 2004 | PHI | 154 | 657 | 14 | 73 | .289 | .803 | 105 |
| 2005 | PHI | 158 | 677 | 12 | 54 | .290 | .770 | 103 |
| 2006 | PHI | 158 | 689 | 25 | 83 | .277 | .811 | 106 |
| 2007 | PHI | 162 | 716 | 30 | 94 | .296 | .875 | 115 |
| 2008 | PHI | 137 | 556 | 11 | 59 | .277 | .786 | 105 |
| 2009 | PHI | 155 | 672 | 21 | 77 | .250 | .719 | 96 |
| 2010 | PHI | 88 | 350 | 8 | 41 | .243 | .694 | 95 |
| 2011 | PHI | 142 | 567 | 16 | 63 | .268 | .736 | 102 |
| 2012 | PHI | 156 | 632 | 23 | 68 | .250 | .743 | 103 |
| 2013 | PHI | 160 | 600 | 6 | 39 | .252 | .667 | 93 |
| 2014 | PHI | 138 | 538 | 17 | 55 | .243 | .717 | 102 |
| 2015 | LAD | 144 | 517 | 13 | 41 | .224 | .643 | 89 |
| 2016 | CWS | 41 | 149 | 2 | 8 | .221 | .624 | 84 |
| Career | 2275 | 9294 | 231 | 936 | .264 | — | — | |
Every ball this hitter has put in play — how hard it left the bat, and at what angle. The red field behind the dots shows how much damage that kind of contact does, league-wide: the darker the red, the better things go for the hitter.
The field — league-average xwOBA (what a batted ball is typically worth: 0.0 is a sure out, ~2.0 a sure home run) for every exit-velocity × launch-angle combination, measured from 1.3 million regular-season balls in play since 2015. The dark ridge — balls hit 105+ mph at 25–30° — is the barrel zone, where contact becomes near-automatic extra bases.
The dots — this hitter’s career regular-season balls in play, grouped to a fine grid; a bigger dot means more batted balls at that exact combination. Dots piled onto the red ridge are damage; dots low on the pale field are weak or mishit contact. Spring training and the postseason are excluded.
Matchups, projections, comps — grounded in Lahman, Retrosheet, and Statcast.