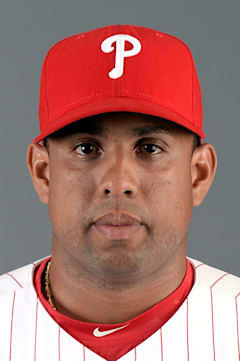
Francisco Rodriguez
K-Rod owned the ninth inning like few closers ever have. Francisco Rodriguez's 2006 season remains one of the most dominant relief performances in baseball history — that 1.73 ERA represented an ERA+ of 261, meaning he was nearly three times better than the average pitcher that year.
The Venezuelan fireballer struck out 11.5 batters per nine innings over his career, a rate that would make modern flamethrowers jealous. His 156 career ERA+ tells the story of sustained excellence across 16 seasons, even as he bounced between multiple teams after his Angels heyday.
Rodriguez saved 437 games in his career, but the raw numbers don't capture his peak dominance. From 2002 to 2009 with Anaheim, he was virtually unhittable in high-leverage spots, turning the ninth inning into appointment television with his slider-fastball combination.
Career · Pitching
16 seasons| Year | Team | G | IP | W | L | ERA | ERA+ | SO | WHIP |
|---|---|---|---|---|---|---|---|---|---|
| 2002 | LAA | 5 | 5.7 | 0 | 0 | 0.00 | — | 13 | 0.882 |
| 2003 | LAA | 59 | 86.0 | 8 | 3 | 3.03 | 145 | 95 | 0.988 |
| 2004 | LAA | 69 | 84.0 | 4 | 1 | 1.82 | 245 | 123 | 1.000 |
| 2005 | LAA | 66 | 67.3 | 2 | 5 | 2.67 | 160 | 91 | 1.144 |
| 2006 | LAA | 69 | 73.0 | 2 | 3 | 1.73 | 261 | 98 | 1.096 |
| 2007 | LAA | 64 | 67.3 | 5 | 2 | 2.81 | 159 | 90 | 1.248 |
| 2008 | LAA | 76 | 68.3 | 2 | 3 | 2.24 | 193 | 77 | 1.288 |
| 2009 | NYM | 70 | 68.0 | 3 | 6 | 3.71 | 116 | 73 | 1.309 |
| 2010 | NYM | 53 | 57.3 | 4 | 2 | 2.20 | 185 | 67 | 1.151 |
| 2011 | NYM | 73 | 71.7 | 6 | 2 | 2.64 | 149 | 79 | 1.298 |
| 2012 | MIL | 78 | 72.0 | 2 | 7 | 4.38 | 92 | 72 | 1.333 |
| 2013 | MIL | 48 | 46.7 | 3 | 2 | 2.70 | 143 | 54 | 1.200 |
| 2014 | MIL | 69 | 68.0 | 5 | 5 | 3.04 | 123 | 73 | 0.985 |
| 2015 | MIL | 60 | 57.0 | 1 | 3 | 2.21 | 179 | 62 | 0.860 |
| 2016 | DET | 61 | 58.3 | 3 | 4 | 3.24 | 129 | 52 | 1.131 |
| 2017 | DET | 28 | 25.3 | 2 | 5 | 7.82 | 56 | 23 | 1.658 |
| Career | 948 | 975.9 | 52 | 53 | — | — | 1142 | — | |
Each pitch type this pitcher throws regularly, placed by how the ball moves — sideways break across, rise or drop down the side. Each dotted ring holds about the middle 85% of the league’s pitches of that type, so a cluster sitting outside its ring is movement most pitchers don’t have.
The dots — a sample of this pitcher’s regular-season pitches, placed by movement: left–right is horizontal break, up–down is induced vertical break (what the pitch does beyond gravity). The view is handedness-neutral — positive break is toward the pitcher’s arm side for lefties and righties alike, so every sinker runs right and every sweeper breaks left, whoever throws it.
The dotted rings — about the middle 85% of where each pitch type lands league-wide (a 2-standard-deviation spread), measured from 7.5 million regular-season pitches since 2015. A cluster sitting well outside its ring is movement most of the league doesn’t get. Spring training and the postseason are excluded.
Matchups, projections, comps — grounded in Lahman, Retrosheet, and Statcast.