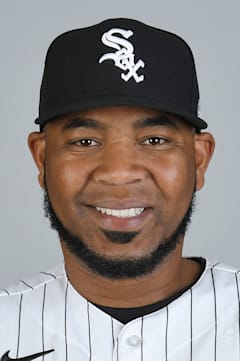
Edwin Encarnacion
The parrot walk defined a generation of Blue Jays fans, but Encarnacion's peak power surge came later than most sluggers. He didn't crack 20 home runs until age 27, then proceeded to launch 239 bombs over his next seven seasons from 2012-2018.
That 2012 breakout wasn't a fluke — Encarnacion became one of baseball's most reliable middle-of-the-order threats, averaging 37 homers per season during his prime Toronto years. His 424 career long balls rank him among the top sluggers of the 2010s, despite never leading the league in any major offensive category.
The Dominican Republic native carved out 16 big league seasons by reinventing himself as a pure designated hitter. His career OPS+ of 112 reveals steady above-average production, built on patience at the plate and legitimate 40-homer power when locked in.
Career · Batting
16 seasons| Year | Team | G | AB | HR | RBI | AVG | OPS | OPS+ |
|---|---|---|---|---|---|---|---|---|
| 2005 | CIN | 69 | 211 | 9 | 31 | .232 | .744 | 99 |
| 2006 | CIN | 117 | 406 | 15 | 72 | .276 | .831 | 108 |
| 2007 | CIN | 139 | 502 | 16 | 76 | .289 | .794 | 105 |
| 2008 | CIN | 146 | 506 | 26 | 68 | .251 | .807 | 108 |
| 2009 | TOR | 85 | 293 | 13 | 39 | .225 | .729 | 97 |
| 2010 | TOR | 96 | 332 | 21 | 51 | .244 | .787 | 108 |
| 2011 | TOR | 134 | 481 | 17 | 55 | .272 | .787 | 109 |
| 2012 | TOR | 151 | 542 | 42 | 110 | .280 | .941 | 130 |
| 2013 | TOR | 142 | 530 | 36 | 104 | .272 | .904 | 127 |
| 2014 | TOR | 128 | 477 | 34 | 98 | .268 | .901 | 129 |
| 2015 | TOR | 146 | 528 | 39 | 111 | .277 | .929 | 129 |
| 2016 | TOR | 160 | 601 | 42 | 127 | .263 | .886 | 120 |
| 2017 | CLE | 157 | 554 | 38 | 107 | .258 | .881 | 117 |
| 2018 | CLE | 137 | 500 | 32 | 107 | .246 | .810 | 111 |
| 2019 | SEA | 109 | 418 | 34 | 86 | .244 | .875 | 116 |
| 2020 | CWS | 44 | 159 | 10 | 19 | .157 | .627 | 85 |
| Career | 1960 | 7040 | 424 | 1261 | .260 | — | — | |
Every ball this hitter has put in play — how hard it left the bat, and at what angle. The red field behind the dots shows how much damage that kind of contact does, league-wide: the darker the red, the better things go for the hitter.
The field — league-average xwOBA (what a batted ball is typically worth: 0.0 is a sure out, ~2.0 a sure home run) for every exit-velocity × launch-angle combination, measured from 1.3 million regular-season balls in play since 2015. The dark ridge — balls hit 105+ mph at 25–30° — is the barrel zone, where contact becomes near-automatic extra bases.
The dots — this hitter’s career regular-season balls in play, grouped to a fine grid; a bigger dot means more batted balls at that exact combination. Dots piled onto the red ridge are damage; dots low on the pale field are weak or mishit contact. Spring training and the postseason are excluded.
Matchups, projections, comps — grounded in Lahman, Retrosheet, and Statcast.