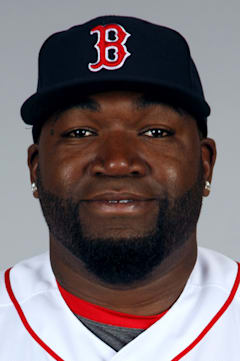
David Ortiz
The most fearsome clutch hitter of his generation never reached his peak until his mid-30s. Ortiz didn't crack 30 home runs until age 27, then proceeded to terrorize American League pitching for the next decade. His 2004-2013 run in Boston represents one of the most sustained periods of offensive dominance by any DH in history.
That 2012 season at age 36 tells the whole story — a .318 average with an OPS+ of 142, proving he was far more than just a slugger. While 541 career homers grab headlines, his .286 lifetime average shows remarkable plate discipline for a power hitter. Three World Series titles cemented his legacy, but the numbers reveal a hitter who got better with age, not worse.
Big Papi's Hall of Fame induction in 2022 validated what Red Sox fans knew all along: October baseball was his laboratory, and he rarely failed the experiment.
Career · Batting
20 seasons| Year | Team | G | AB | HR | RBI | AVG | OPS | OPS+ |
|---|---|---|---|---|---|---|---|---|
| 1997 | MIN | 15 | 49 | 1 | 6 | .327 | .802 | 106 |
| 1998 | MIN | 86 | 278 | 9 | 46 | .277 | .817 | 108 |
| 1999 | MIN | 10 | 20 | 0 | 0 | .000 | .200 | 26 |
| 2000 | MIN | 130 | 415 | 10 | 63 | .282 | .810 | 104 |
| 2001 | MIN | 89 | 303 | 18 | 48 | .234 | .799 | 105 |
| 2002 | MIN | 125 | 412 | 20 | 75 | .272 | .839 | 112 |
| 2003 | BOS | 128 | 448 | 31 | 101 | .288 | .961 | 127 |
| 2004 | BOS | 150 | 582 | 41 | 139 | .301 | .983 | 129 |
| 2005 | BOS | 159 | 601 | 47 | 148 | .300 | 1.001 | 134 |
| 2006 | BOS | 151 | 558 | 54 | 137 | .287 | 1.049 | 137 |
| 2007 | BOS | 149 | 549 | 35 | 117 | .332 | 1.066 | 141 |
| 2008 | BOS | 109 | 416 | 23 | 89 | .264 | .877 | 117 |
| 2009 | BOS | 150 | 541 | 28 | 99 | .238 | .794 | 106 |
| 2010 | BOS | 145 | 518 | 32 | 102 | .270 | .899 | 123 |
| 2011 | BOS | 146 | 525 | 29 | 96 | .309 | .953 | 132 |
| 2012 | BOS | 90 | 324 | 23 | 60 | .318 | 1.026 | 142 |
| 2013 | BOS | 137 | 518 | 30 | 103 | .309 | .959 | 134 |
| 2014 | BOS | 142 | 518 | 35 | 104 | .263 | .873 | 125 |
| 2015 | BOS | 146 | 528 | 37 | 108 | .273 | .913 | 127 |
| 2016 | BOS | 151 | 537 | 38 | 127 | .315 | 1.021 | 138 |
| Career | 2408 | 8640 | 541 | 1768 | .286 | — | — | |
Every ball this hitter has put in play — how hard it left the bat, and at what angle. The red field behind the dots shows how much damage that kind of contact does, league-wide: the darker the red, the better things go for the hitter.
The field — league-average xwOBA (what a batted ball is typically worth: 0.0 is a sure out, ~2.0 a sure home run) for every exit-velocity × launch-angle combination, measured from 1.3 million regular-season balls in play since 2015. The dark ridge — balls hit 105+ mph at 25–30° — is the barrel zone, where contact becomes near-automatic extra bases.
The dots — this hitter’s career regular-season balls in play, grouped to a fine grid; a bigger dot means more batted balls at that exact combination. Dots piled onto the red ridge are damage; dots low on the pale field are weak or mishit contact. Spring training and the postseason are excluded.
Matchups, projections, comps — grounded in Lahman, Retrosheet, and Statcast.