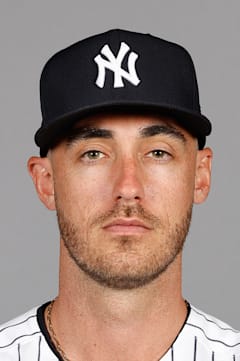
Cody Bellinger
The Cubs struck gold with Bellinger's bounce-back campaign in 2024, but his career arc remains one of baseball's most puzzling riddles. After exploding onto the scene with back-to-back Rookie of the Year honors and that monster 2019 MVP season, he cratered so dramatically in Los Angeles that the Dodgers non-tendered him rather than pay arbitration wages.
Chicago's gamble paid off handsomely as Bellinger rediscovered his swing, posting numbers that reminded everyone why he once seemed destined for Cooperstown. His career 110 OPS+ tells the story of a player who's been genuinely excellent when healthy and locked in, but maddeningly inconsistent year to year.
The key question heading into 2025: can he sustain this resurgence, or will the player who hit .165 in 2022 resurface? At 31, with 225 career homers already banked, Bellinger still has time to cement a strong legacy if he can find the consistency that's eluded him.
| Date | AB | H | HR | RBI | BB | SO | AVG |
|---|---|---|---|---|---|---|---|
| Jul 17 | 4 | 1 | 0 | 0 | 0 | 2 | .254 |
| Jul 14 | 3 | 1 | 0 | 2 | 0 | 0 | .333 |
| Jul 12 | 3 | 2 | 0 | 0 | 1 | 0 | .254 |
| Jul 11 | 4 | 1 | 0 | 0 | 0 | 0 | .250 |
| Jul 10 | 4 | 2 | 0 | 0 | 0 | 0 | .250 |
| Jul 9 | 5 | 2 | 0 | 1 | 0 | 0 | .247 |
| Jul 8 | 4 | 0 | 0 | 0 | 0 | 2 | .245 |
| Jul 7 | 4 | 1 | 0 | 0 | 0 | 2 | .248 |
| Jul 6 | 4 | 0 | 0 | 0 | 0 | 3 | .248 |
| Jul 5 | 4 | 1 | 0 | 0 | 0 | 1 | .251 |
Career · Batting
10 seasons| Year | Team | G | AB | HR | RBI | AVG | OPS | OPS+ |
|---|---|---|---|---|---|---|---|---|
| 2017 | — | 132 | 480 | 39 | 97 | — | — | — |
| 2018 | — | 162 | 557 | 25 | 76 | — | — | — |
| 2019 | — | 156 | 558 | 47 | 115 | — | 1.035 | — |
| 2020 | — | 56 | 213 | 12 | 30 | — | — | — |
| 2021 | — | 95 | 315 | 10 | 36 | — | — | — |
| 2022 | — | 144 | 504 | 19 | 68 | — | — | — |
| 2023 | — | 130 | 499 | 26 | 97 | — | — | — |
| 2024 | — | 130 | 516 | 18 | 78 | — | — | — |
| 2025 | — | 152 | 588 | 29 | 98 | — | — | — |
| 2026 | — | 97 | 357 | 11 | 52 | — | — | — |
| Career | 1254 | 4587 | 236 | 747 | — | — | — | |
Every ball this hitter has put in play — how hard it left the bat, and at what angle. The red field behind the dots shows how much damage that kind of contact does, league-wide: the darker the red, the better things go for the hitter.
The field — league-average xwOBA (what a batted ball is typically worth: 0.0 is a sure out, ~2.0 a sure home run) for every exit-velocity × launch-angle combination, measured from 1.3 million regular-season balls in play since 2015. The dark ridge — balls hit 105+ mph at 25–30° — is the barrel zone, where contact becomes near-automatic extra bases.
The dots — this hitter’s career regular-season balls in play, grouped to a fine grid; a bigger dot means more batted balls at that exact combination. Dots piled onto the red ridge are damage; dots low on the pale field are weak or mishit contact. Spring training and the postseason are excluded.
Matchups, projections, comps — grounded in Lahman, Retrosheet, and Statcast.