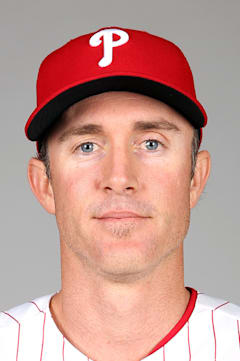
Chase Utley
The most underrated second baseman of the 2000s spent his prime years terrorizing NL East pitching with a swing tailor-made for Citizens Bank Park. Utley's 2007 campaign — a .332 average with 22 homers and a .976 OPS — represents the peak of what made him special: uncommon power from the keystone position wrapped in a complete offensive package.
That OPS+ of 129 in his best season tells the story of a player who was nearly 30 percent better than league average at his peak, yet somehow flew under the radar nationally. Six All-Star selections and four Silver Sluggers validate what Phillies fans knew: Utley was the steady heartbeat of those championship teams.
His 259 career homers rank among the highest totals for second basemen in the modern era, proof that his swing played bigger than his .275 career average suggests. The kind of player who aged gracefully, maintaining value even as the counting stats declined.
Career · Batting
16 seasons| Year | Team | G | AB | HR | RBI | AVG | OPS | OPS+ |
|---|---|---|---|---|---|---|---|---|
| 2003 | PHI | 43 | 134 | 2 | 21 | .239 | .696 | 92 |
| 2004 | PHI | 94 | 267 | 13 | 57 | .266 | .776 | 102 |
| 2005 | PHI | 147 | 543 | 28 | 105 | .291 | .915 | 122 |
| 2006 | PHI | 160 | 658 | 32 | 102 | .309 | .906 | 118 |
| 2007 | PHI | 132 | 530 | 22 | 103 | .332 | .976 | 129 |
| 2008 | PHI | 159 | 607 | 33 | 104 | .292 | .915 | 122 |
| 2009 | PHI | 156 | 571 | 31 | 93 | .282 | .905 | 121 |
| 2010 | PHI | 115 | 425 | 16 | 65 | .275 | .832 | 114 |
| 2011 | PHI | 103 | 398 | 11 | 44 | .259 | .769 | 107 |
| 2012 | PHI | 83 | 301 | 11 | 45 | .256 | .793 | 109 |
| 2013 | PHI | 131 | 476 | 18 | 69 | .284 | .823 | 115 |
| 2014 | PHI | 155 | 589 | 11 | 78 | .270 | .746 | 107 |
| 2015 | PHI | 107 | 373 | 8 | 39 | .212 | .629 | 87 |
| 2016 | LAD | 138 | 512 | 14 | 52 | .252 | .716 | 97 |
| 2017 | LAD | 127 | 309 | 8 | 34 | .236 | .728 | 97 |
| 2018 | LAD | 87 | 164 | 1 | 14 | .213 | .610 | 84 |
| Career | 1937 | 6857 | 259 | 1025 | .275 | — | — | |
Every ball this hitter has put in play — how hard it left the bat, and at what angle. The red field behind the dots shows how much damage that kind of contact does, league-wide: the darker the red, the better things go for the hitter.
The field — league-average xwOBA (what a batted ball is typically worth: 0.0 is a sure out, ~2.0 a sure home run) for every exit-velocity × launch-angle combination, measured from 1.3 million regular-season balls in play since 2015. The dark ridge — balls hit 105+ mph at 25–30° — is the barrel zone, where contact becomes near-automatic extra bases.
The dots — this hitter’s career regular-season balls in play, grouped to a fine grid; a bigger dot means more batted balls at that exact combination. Dots piled onto the red ridge are damage; dots low on the pale field are weak or mishit contact. Spring training and the postseason are excluded.
Matchups, projections, comps — grounded in Lahman, Retrosheet, and Statcast.