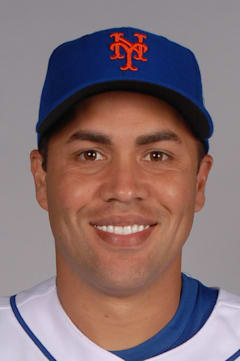
Carlos Beltran
The numbers don't tell the full story of Beltran's postseason wizardry — he turned October into his personal highlight reel, most memorably in 2004 when he carried Houston with eight home runs in 12 playoff games. That performance alone should have cemented his legacy, but somehow he remained underrated throughout his 20-year career.
His 435 home runs and nine All-Star selections speak to remarkable consistency, but the real measure of Beltran's excellence lies in that career 111 OPS+. He delivered above-average offensive production while playing premium defense in center field for two decades, peaking with that monster 2006 season in New York where his .982 OPS represented a 28 percent improvement over league average.
The Puerto Rican outfielder combined power, speed, and defensive brilliance in a package that defined the complete modern center fielder. His three Gold Gloves only scratch the surface of his defensive impact across multiple organizations.
Career · Batting
20 seasons| Year | Team | G | AB | HR | RBI | AVG | OPS | OPS+ |
|---|---|---|---|---|---|---|---|---|
| 1998 | KC | 14 | 58 | 0 | 7 | .276 | .783 | 104 |
| 1999 | KC | 156 | 663 | 22 | 108 | .293 | .791 | 102 |
| 2000 | KC | 98 | 372 | 7 | 44 | .247 | .675 | 86 |
| 2001 | KC | 155 | 617 | 24 | 101 | .306 | .876 | 115 |
| 2002 | KC | 162 | 637 | 29 | 105 | .273 | .847 | 113 |
| 2003 | KC | 141 | 521 | 26 | 100 | .307 | .911 | 121 |
| 2004 | HOU | 159 | 599 | 38 | 104 | .267 | .915 | 120 |
| 2005 | NYM | 151 | 582 | 16 | 78 | .266 | .744 | 99 |
| 2006 | NYM | 140 | 510 | 41 | 116 | .275 | .982 | 128 |
| 2007 | NYM | 144 | 554 | 33 | 112 | .276 | .878 | 116 |
| 2008 | NYM | 161 | 606 | 27 | 112 | .284 | .876 | 117 |
| 2009 | NYM | 81 | 308 | 10 | 48 | .325 | .915 | 122 |
| 2010 | NYM | 64 | 220 | 7 | 27 | .255 | .768 | 105 |
| 2011 | NYM | 142 | 520 | 22 | 84 | .300 | .910 | 126 |
| 2012 | STL | 151 | 547 | 32 | 97 | .269 | .842 | 116 |
| 2013 | STL | 145 | 554 | 24 | 84 | .296 | .830 | 116 |
| 2014 | NYY | 109 | 403 | 15 | 49 | .233 | .703 | 100 |
| 2015 | NYY | 133 | 478 | 19 | 67 | .276 | .808 | 112 |
| 2016 | NYY | 151 | 552 | 29 | 93 | .295 | .850 | 115 |
| 2017 | HOU | 129 | 467 | 14 | 51 | .231 | .666 | 89 |
| Career | 2586 | 9768 | 435 | 1587 | .279 | — | — | |
Every ball this hitter has put in play — how hard it left the bat, and at what angle. The red field behind the dots shows how much damage that kind of contact does, league-wide: the darker the red, the better things go for the hitter.
The field — league-average xwOBA (what a batted ball is typically worth: 0.0 is a sure out, ~2.0 a sure home run) for every exit-velocity × launch-angle combination, measured from 1.3 million regular-season balls in play since 2015. The dark ridge — balls hit 105+ mph at 25–30° — is the barrel zone, where contact becomes near-automatic extra bases.
The dots — this hitter’s career regular-season balls in play, grouped to a fine grid; a bigger dot means more batted balls at that exact combination. Dots piled onto the red ridge are damage; dots low on the pale field are weak or mishit contact. Spring training and the postseason are excluded.
Matchups, projections, comps — grounded in Lahman, Retrosheet, and Statcast.