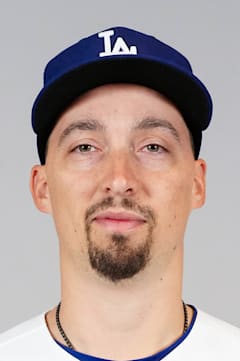
Blake Snell
Snell's defining trait isn't his two Cy Young awards — it's his maddening inconsistency. The southpaw can dominate hitters for months, then struggle to find the strike zone the next. His 2018 masterpiece (1.89 ERA, 219 ERA+) stands as one of the decade's finest pitching seasons, yet he followed it with campaigns that left scouts scratching their heads.
At 34, Snell remains baseball's ultimate wild card. His 140 career ERA+ proves the talent, but his 81-62 record reflects a pitcher who's never quite figured out how to harness his electric stuff consistently. The strikeout rate stays elite — 1,440 whiffs in 1,158 innings — but walks have plagued him throughout his career.
The intrigue with Snell has always been his ceiling versus his floor. When locked in, few pitchers generate more swing-and-miss. When off, he can implode spectacularly. That volatility makes him fascinating but frustrating — a Cy Young winner who somehow feels like he's still searching for his true form.
| Date | IP | H | ER | BB | SO | HR | Dec |
|---|---|---|---|---|---|---|---|
| May 9 | 3 | 6 | 4 | 2 | 5 | 0 | L |
Career · Hitting
6 seasons| Year | Team | G | AB | HR | RBI | AVG | OPS | OPS+ |
|---|---|---|---|---|---|---|---|---|
| 2016 | — | 19 | 2 | 0 | 0 | — | — | — |
| 2017 | — | 24 | 5 | 0 | 0 | — | — | — |
| 2018 | — | 31 | 1 | 0 | 0 | — | — | — |
| 2019 | — | 23 | 0 | 0 | 0 | — | — | — |
| 2021 | — | 27 | 34 | 0 | 0 | — | — | — |
| 2022 | — | 25 | 0 | 0 | 0 | — | — | — |
| Career | 149 | 42 | 0 | 0 | — | — | — | |
Career · Pitching
11 seasons| Year | Team | G | IP | W | L | ERA | ERA+ | SO | WHIP |
|---|---|---|---|---|---|---|---|---|---|
| 2016 | — | 19 | 89.0 | 6 | 8 | 3.54 | — | 98 | 1.62 |
| 2017 | — | 24 | 129.1 | 5 | 7 | 4.04 | — | 119 | 1.33 |
| 2018 | — | 31 | 180.2 | 21 | 5 | 1.89 | — | 221 | 0.97 |
| 2019 | — | 23 | 107.0 | 6 | 8 | 4.29 | — | 147 | 1.27 |
| 2020 | — | 11 | 50.0 | 4 | 2 | 3.24 | — | 63 | 1.20 |
| 2021 | — | 27 | 128.2 | 7 | 6 | 4.20 | — | 170 | 1.32 |
| 2022 | — | 24 | 128.0 | 8 | 10 | 3.38 | — | 171 | 1.20 |
| 2023 | — | 32 | 180.0 | 14 | 9 | 2.25 | — | 234 | 1.19 |
| 2024 | — | 20 | 104.0 | 5 | 3 | 3.12 | — | 145 | 1.05 |
| 2025 | — | 11 | 61.1 | 5 | 4 | 2.35 | — | 72 | 1.26 |
| 2026 | — | 1 | 3.0 | 0 | 1 | 12.00 | — | 5 | 2.67 |
| Career | 223 | 1159.6 | 81 | 63 | — | — | 1445 | — | |
Each pitch type this pitcher throws regularly, placed by how the ball moves — sideways break across, rise or drop down the side. Each dotted ring holds about the middle 85% of the league’s pitches of that type, so a cluster sitting outside its ring is movement most pitchers don’t have.
The dots — a sample of this pitcher’s regular-season pitches, placed by movement: left–right is horizontal break, up–down is induced vertical break (what the pitch does beyond gravity). The view is handedness-neutral — positive break is toward the pitcher’s arm side for lefties and righties alike, so every sinker runs right and every sweeper breaks left, whoever throws it.
The dotted rings — about the middle 85% of where each pitch type lands league-wide (a 2-standard-deviation spread), measured from 7.5 million regular-season pitches since 2015. A cluster sitting well outside its ring is movement most of the league doesn’t get. Spring training and the postseason are excluded.
Matchups, projections, comps — grounded in Lahman, Retrosheet, and Statcast.