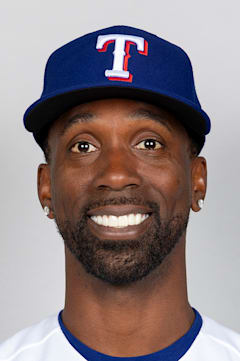
Andrew McCutchen
The most remarkable thing about McCutchen's twilight isn't that he's still playing at 40 — it's that he's defied the typical aging curve by maintaining relevance across three different decades. While his peak MVP form from Pittsburgh feels distant, his .271 career average and 112 OPS+ represent sustained excellence that few center fielders achieve over 17 seasons.
His 2014 campaign stands as the crown jewel: a .314 average with an OPS+ of 136 that showcased why he became the face of baseball in Pittsburgh. That season captured McCutchen at his most complete — elite contact hitting paired with Gold Glove defense in center field.
What's fascinating is how he's accumulated 332 career home runs without ever being considered a traditional power hitter. McCutchen built his case through consistency rather than peak dominance, collecting hardware along the way but never quite reaching the inner circle of Hall of Fame consideration.
Career · Batting
17 seasons| Year | Team | G | AB | HR | RBI | AVG | OPS | OPS+ |
|---|---|---|---|---|---|---|---|---|
| 2009 | PIT | 108 | 433 | 12 | 54 | .286 | .836 | 111 |
| 2010 | PIT | 154 | 570 | 16 | 56 | .286 | .814 | 112 |
| 2011 | PIT | 158 | 572 | 23 | 89 | .259 | .820 | 114 |
| 2012 | PIT | 157 | 593 | 31 | 96 | .327 | .953 | 132 |
| 2013 | PIT | 157 | 583 | 21 | 84 | .317 | .911 | 128 |
| 2014 | PIT | 146 | 548 | 25 | 83 | .314 | .952 | 136 |
| 2015 | PIT | 157 | 566 | 23 | 96 | .292 | .889 | 123 |
| 2016 | PIT | 153 | 598 | 24 | 79 | .256 | .766 | 104 |
| 2017 | PIT | 156 | 570 | 28 | 88 | .279 | .849 | 113 |
| 2018 | SF | 155 | 569 | 20 | 65 | .255 | .792 | 109 |
| 2019 | PHI | 59 | 219 | 10 | 29 | .256 | .834 | 110 |
| 2020 | PHI | 57 | 217 | 10 | 34 | .253 | .757 | 102 |
| 2021 | PHI | 144 | 482 | 27 | 80 | .222 | .778 | 107 |
| 2022 | MIL | 134 | 515 | 17 | 69 | .237 | .700 | 99 |
| 2023 | PIT | 112 | 390 | 12 | 43 | .256 | .776 | 106 |
| 2024 | PIT | 120 | 448 | 20 | 50 | .232 | .739 | 104 |
| 2025 | PIT | 135 | 477 | 13 | 57 | .239 | .700 | 97 |
| Career | 2262 | 8350 | 332 | 1152 | .271 | — | — | |
Every ball this hitter has put in play — how hard it left the bat, and at what angle. The red field behind the dots shows how much damage that kind of contact does, league-wide: the darker the red, the better things go for the hitter.
The field — league-average xwOBA (what a batted ball is typically worth: 0.0 is a sure out, ~2.0 a sure home run) for every exit-velocity × launch-angle combination, measured from 1.3 million regular-season balls in play since 2015. The dark ridge — balls hit 105+ mph at 25–30° — is the barrel zone, where contact becomes near-automatic extra bases.
The dots — this hitter’s career regular-season balls in play, grouped to a fine grid; a bigger dot means more batted balls at that exact combination. Dots piled onto the red ridge are damage; dots low on the pale field are weak or mishit contact. Spring training and the postseason are excluded.
Matchups, projections, comps — grounded in Lahman, Retrosheet, and Statcast.