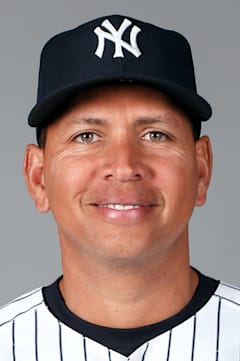
Alex Rodriguez
A-Rod became the youngest player to reach 500 home runs, getting there at age 32 in 2007 — the same season he delivered his best offensive performance with 54 homers and 156 RBIs while posting a career-high 1.067 OPS. That peak came during his transition from shortstop to third base, where he won two Gold Gloves after moving to accommodate Derek Jeter.
The three MVP awards tell only part of the story. Rodriguez combined elite power with surprising plate discipline, walking 100+ times in seven seasons while maintaining a .295 career average across 22 seasons. His 696 home runs rank fourth all-time, with 351 coming as a shortstop — more than any other player at the position.
What separated Rodriguez was his ability to produce at premium defensive positions. His 117 career OPS+ as a middle infielder represents sustained excellence few have matched, making him one of the most complete players of the expansion era.
Career · Batting
22 seasons| Year | Team | G | AB | HR | RBI | AVG | OPS | OPS+ |
|---|---|---|---|---|---|---|---|---|
| 1994 | SEA | 17 | 54 | 0 | 2 | .204 | .445 | 58 |
| 1995 | SEA | 48 | 142 | 5 | 19 | .232 | .672 | 89 |
| 1996 | SEA | 146 | 601 | 36 | 123 | .358 | 1.045 | 136 |
| 1997 | SEA | 141 | 587 | 23 | 84 | .300 | .846 | 112 |
| 1998 | SEA | 161 | 686 | 42 | 124 | .310 | .919 | 122 |
| 1999 | SEA | 129 | 502 | 42 | 111 | .285 | .943 | 121 |
| 2000 | SEA | 148 | 554 | 41 | 132 | .316 | 1.026 | 131 |
| 2001 | TEX | 162 | 632 | 52 | 135 | .318 | 1.021 | 135 |
| 2002 | TEX | 162 | 624 | 57 | 142 | .300 | 1.015 | 136 |
| 2003 | TEX | 161 | 607 | 47 | 118 | .298 | .995 | 132 |
| 2004 | NYY | 155 | 601 | 36 | 106 | .286 | .888 | 116 |
| 2005 | NYY | 162 | 605 | 48 | 130 | .321 | 1.031 | 138 |
| 2006 | NYY | 154 | 572 | 35 | 121 | .290 | .914 | 119 |
| 2007 | NYY | 158 | 583 | 54 | 156 | .314 | 1.067 | 141 |
| 2008 | NYY | 138 | 510 | 35 | 103 | .302 | .965 | 129 |
| 2009 | NYY | 124 | 444 | 30 | 100 | .286 | .933 | 124 |
| 2010 | NYY | 137 | 522 | 30 | 125 | .270 | .847 | 116 |
| 2011 | NYY | 99 | 373 | 16 | 62 | .276 | .823 | 114 |
| 2012 | NYY | 122 | 463 | 18 | 57 | .272 | .783 | 108 |
| 2013 | NYY | 44 | 156 | 7 | 19 | .244 | .771 | 108 |
| 2015 | NYY | 151 | 523 | 33 | 86 | .250 | .842 | 117 |
| 2016 | NYY | 65 | 225 | 9 | 31 | .200 | .598 | 81 |
| Career | 2784 | 10566 | 696 | 2086 | .295 | — | — | |
Every ball this hitter has put in play — how hard it left the bat, and at what angle. The red field behind the dots shows how much damage that kind of contact does, league-wide: the darker the red, the better things go for the hitter.
The field — league-average xwOBA (what a batted ball is typically worth: 0.0 is a sure out, ~2.0 a sure home run) for every exit-velocity × launch-angle combination, measured from 1.3 million regular-season balls in play since 2015. The dark ridge — balls hit 105+ mph at 25–30° — is the barrel zone, where contact becomes near-automatic extra bases.
The dots — this hitter’s career regular-season balls in play, grouped to a fine grid; a bigger dot means more batted balls at that exact combination. Dots piled onto the red ridge are damage; dots low on the pale field are weak or mishit contact. Spring training and the postseason are excluded.
Matchups, projections, comps — grounded in Lahman, Retrosheet, and Statcast.