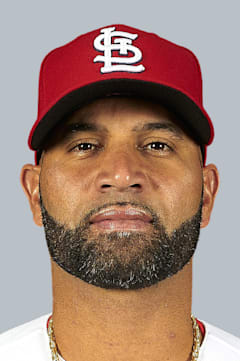
Albert Pujols
Pujols delivered the most dominant debut decade in modern baseball history, posting a .331 average with 408 home runs from 2001-2010 — numbers that belonged in a video game, not real life. His 2008 campaign stands as perhaps the most complete offensive season of the 21st century, flirting with .400 while maintaining elite power.
The Dominican slugger's career arc tells two distinct stories. Those first ten seasons in St. Louis produced three MVPs and established him as the heir to Stan Musial. The Angels years revealed Father Time's cruel math, as his OPS+ dropped from superhuman levels to merely above-average. Still, 703 career home runs speaks to sustained excellence few have ever achieved.
What separated Pujols wasn't just the raw numbers but the situational brilliance — clutch hits in October, protection for teammates, and an approach that aged better than his legs. Hall of Fame voters won't need long to deliberate.
Career · Batting
22 seasons| Year | Team | G | AB | HR | RBI | AVG | OPS | OPS+ |
|---|---|---|---|---|---|---|---|---|
| 2001 | STL | 161 | 590 | 37 | 130 | .329 | 1.013 | 133 |
| 2002 | STL | 157 | 590 | 34 | 127 | .314 | .955 | 128 |
| 2003 | STL | 157 | 591 | 43 | 124 | .359 | 1.106 | 147 |
| 2004 | STL | 154 | 592 | 46 | 123 | .331 | 1.072 | 141 |
| 2005 | STL | 161 | 591 | 41 | 117 | .330 | 1.039 | 139 |
| 2006 | STL | 143 | 535 | 49 | 137 | .331 | 1.102 | 143 |
| 2007 | STL | 158 | 565 | 32 | 103 | .327 | .997 | 131 |
| 2008 | STL | 148 | 524 | 37 | 116 | .357 | 1.114 | 149 |
| 2009 | STL | 160 | 568 | 47 | 135 | .327 | 1.101 | 147 |
| 2010 | STL | 159 | 587 | 42 | 118 | .312 | 1.011 | 139 |
| 2011 | STL | 147 | 579 | 37 | 99 | .299 | .906 | 126 |
| 2012 | LAA | 154 | 607 | 30 | 105 | .285 | .859 | 119 |
| 2013 | LAA | 99 | 391 | 17 | 64 | .258 | .767 | 107 |
| 2014 | LAA | 159 | 633 | 28 | 105 | .272 | .790 | 113 |
| 2015 | LAA | 157 | 602 | 40 | 95 | .244 | .787 | 109 |
| 2016 | LAA | 152 | 593 | 31 | 119 | .268 | .780 | 106 |
| 2017 | LAA | 149 | 593 | 23 | 101 | .241 | .672 | 90 |
| 2018 | LAA | 117 | 465 | 19 | 64 | .245 | .700 | 96 |
| 2019 | LAA | 131 | 491 | 23 | 93 | .244 | .734 | 97 |
| 2020 | LAA | 39 | 152 | 6 | 25 | .224 | .665 | 90 |
| 2021 | LAD | 109 | 275 | 17 | 50 | .236 | .717 | 99 |
| 2022 | STL | 109 | 307 | 24 | 68 | .270 | .895 | 127 |
| Career | 3080 | 11421 | 703 | 2218 | .296 | — | — | |
Every ball this hitter has put in play — how hard it left the bat, and at what angle. The red field behind the dots shows how much damage that kind of contact does, league-wide: the darker the red, the better things go for the hitter.
The field — league-average xwOBA (what a batted ball is typically worth: 0.0 is a sure out, ~2.0 a sure home run) for every exit-velocity × launch-angle combination, measured from 1.3 million regular-season balls in play since 2015. The dark ridge — balls hit 105+ mph at 25–30° — is the barrel zone, where contact becomes near-automatic extra bases.
The dots — this hitter’s career regular-season balls in play, grouped to a fine grid; a bigger dot means more batted balls at that exact combination. Dots piled onto the red ridge are damage; dots low on the pale field are weak or mishit contact. Spring training and the postseason are excluded.
Matchups, projections, comps — grounded in Lahman, Retrosheet, and Statcast.