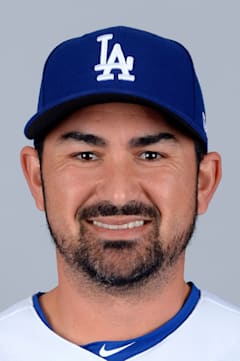
Adrian Gonzalez
Gonzalez was the rare first baseman who could anchor both sides of the ball, collecting four Gold Gloves while slugging 317 career home runs. His 2011 season in Boston stands as a masterclass in complete offensive production — that .338 average with 27 homers and 117 RBIs delivered his career-best 133 OPS+.
The Mexican-born slugger's consistency defined his prime years. He posted seven consecutive seasons with at least 100 RBIs from 2006-2012, a testament to his ability to drive in runs without massive home run totals. His career 109 OPS+ across 15 seasons shows he was a steady above-average hitter who never had a truly dominant peak but rarely disappointed.
What separates Gonzalez from typical slugging first basemen was his defensive excellence. Those four Gold Gloves weren't ceremonial — he combined soft hands with excellent footwork around the bag, making him a complete player rather than just a designated hitter masquerading at first base.
Career · Batting
15 seasons| Year | Team | G | AB | HR | RBI | AVG | OPS | OPS+ |
|---|---|---|---|---|---|---|---|---|
| 2004 | TEX | 16 | 42 | 1 | 7 | .238 | .654 | 86 |
| 2005 | TEX | 43 | 150 | 6 | 17 | .227 | .678 | 90 |
| 2006 | SD | 156 | 570 | 24 | 82 | .304 | .862 | 112 |
| 2007 | SD | 161 | 646 | 30 | 100 | .282 | .849 | 112 |
| 2008 | SD | 162 | 616 | 36 | 119 | .279 | .871 | 116 |
| 2009 | SD | 160 | 552 | 40 | 99 | .277 | .958 | 128 |
| 2010 | SD | 160 | 591 | 31 | 101 | .298 | .904 | 124 |
| 2011 | BOS | 159 | 630 | 27 | 117 | .338 | .957 | 133 |
| 2012 | BOS | 159 | 629 | 18 | 108 | .299 | .806 | 111 |
| 2013 | LAD | 157 | 583 | 22 | 100 | .293 | .803 | 112 |
| 2014 | LAD | 159 | 591 | 27 | 116 | .276 | .817 | 117 |
| 2015 | LAD | 156 | 571 | 28 | 90 | .275 | .830 | 115 |
| 2016 | LAD | 156 | 568 | 18 | 90 | .285 | .784 | 106 |
| 2017 | LAD | 71 | 231 | 3 | 30 | .242 | .642 | 86 |
| 2018 | NYM | 54 | 169 | 6 | 26 | .237 | .672 | 92 |
| Career | 1929 | 7139 | 317 | 1202 | .287 | — | — | |
Every ball this hitter has put in play — how hard it left the bat, and at what angle. The red field behind the dots shows how much damage that kind of contact does, league-wide: the darker the red, the better things go for the hitter.
The field — league-average xwOBA (what a batted ball is typically worth: 0.0 is a sure out, ~2.0 a sure home run) for every exit-velocity × launch-angle combination, measured from 1.3 million regular-season balls in play since 2015. The dark ridge — balls hit 105+ mph at 25–30° — is the barrel zone, where contact becomes near-automatic extra bases.
The dots — this hitter’s career regular-season balls in play, grouped to a fine grid; a bigger dot means more batted balls at that exact combination. Dots piled onto the red ridge are damage; dots low on the pale field are weak or mishit contact. Spring training and the postseason are excluded.
Matchups, projections, comps — grounded in Lahman, Retrosheet, and Statcast.